Heatmap
Render an Heatmap
The heatmap is managed by the Map Render component:
Use the geoJsonModeSelection as Heatmap to render an Heatmap layer:
import { MapRender } from "@matchplat/crono";

<MapRender geoJsonModeSelection={"Heatmap"} />;
or you can let the user activate the control to toggle an Heatmap
import { MapRender } from "@matchplat/crono";

<MapRender heatClusterToggle={{ activateControl: true }} />;
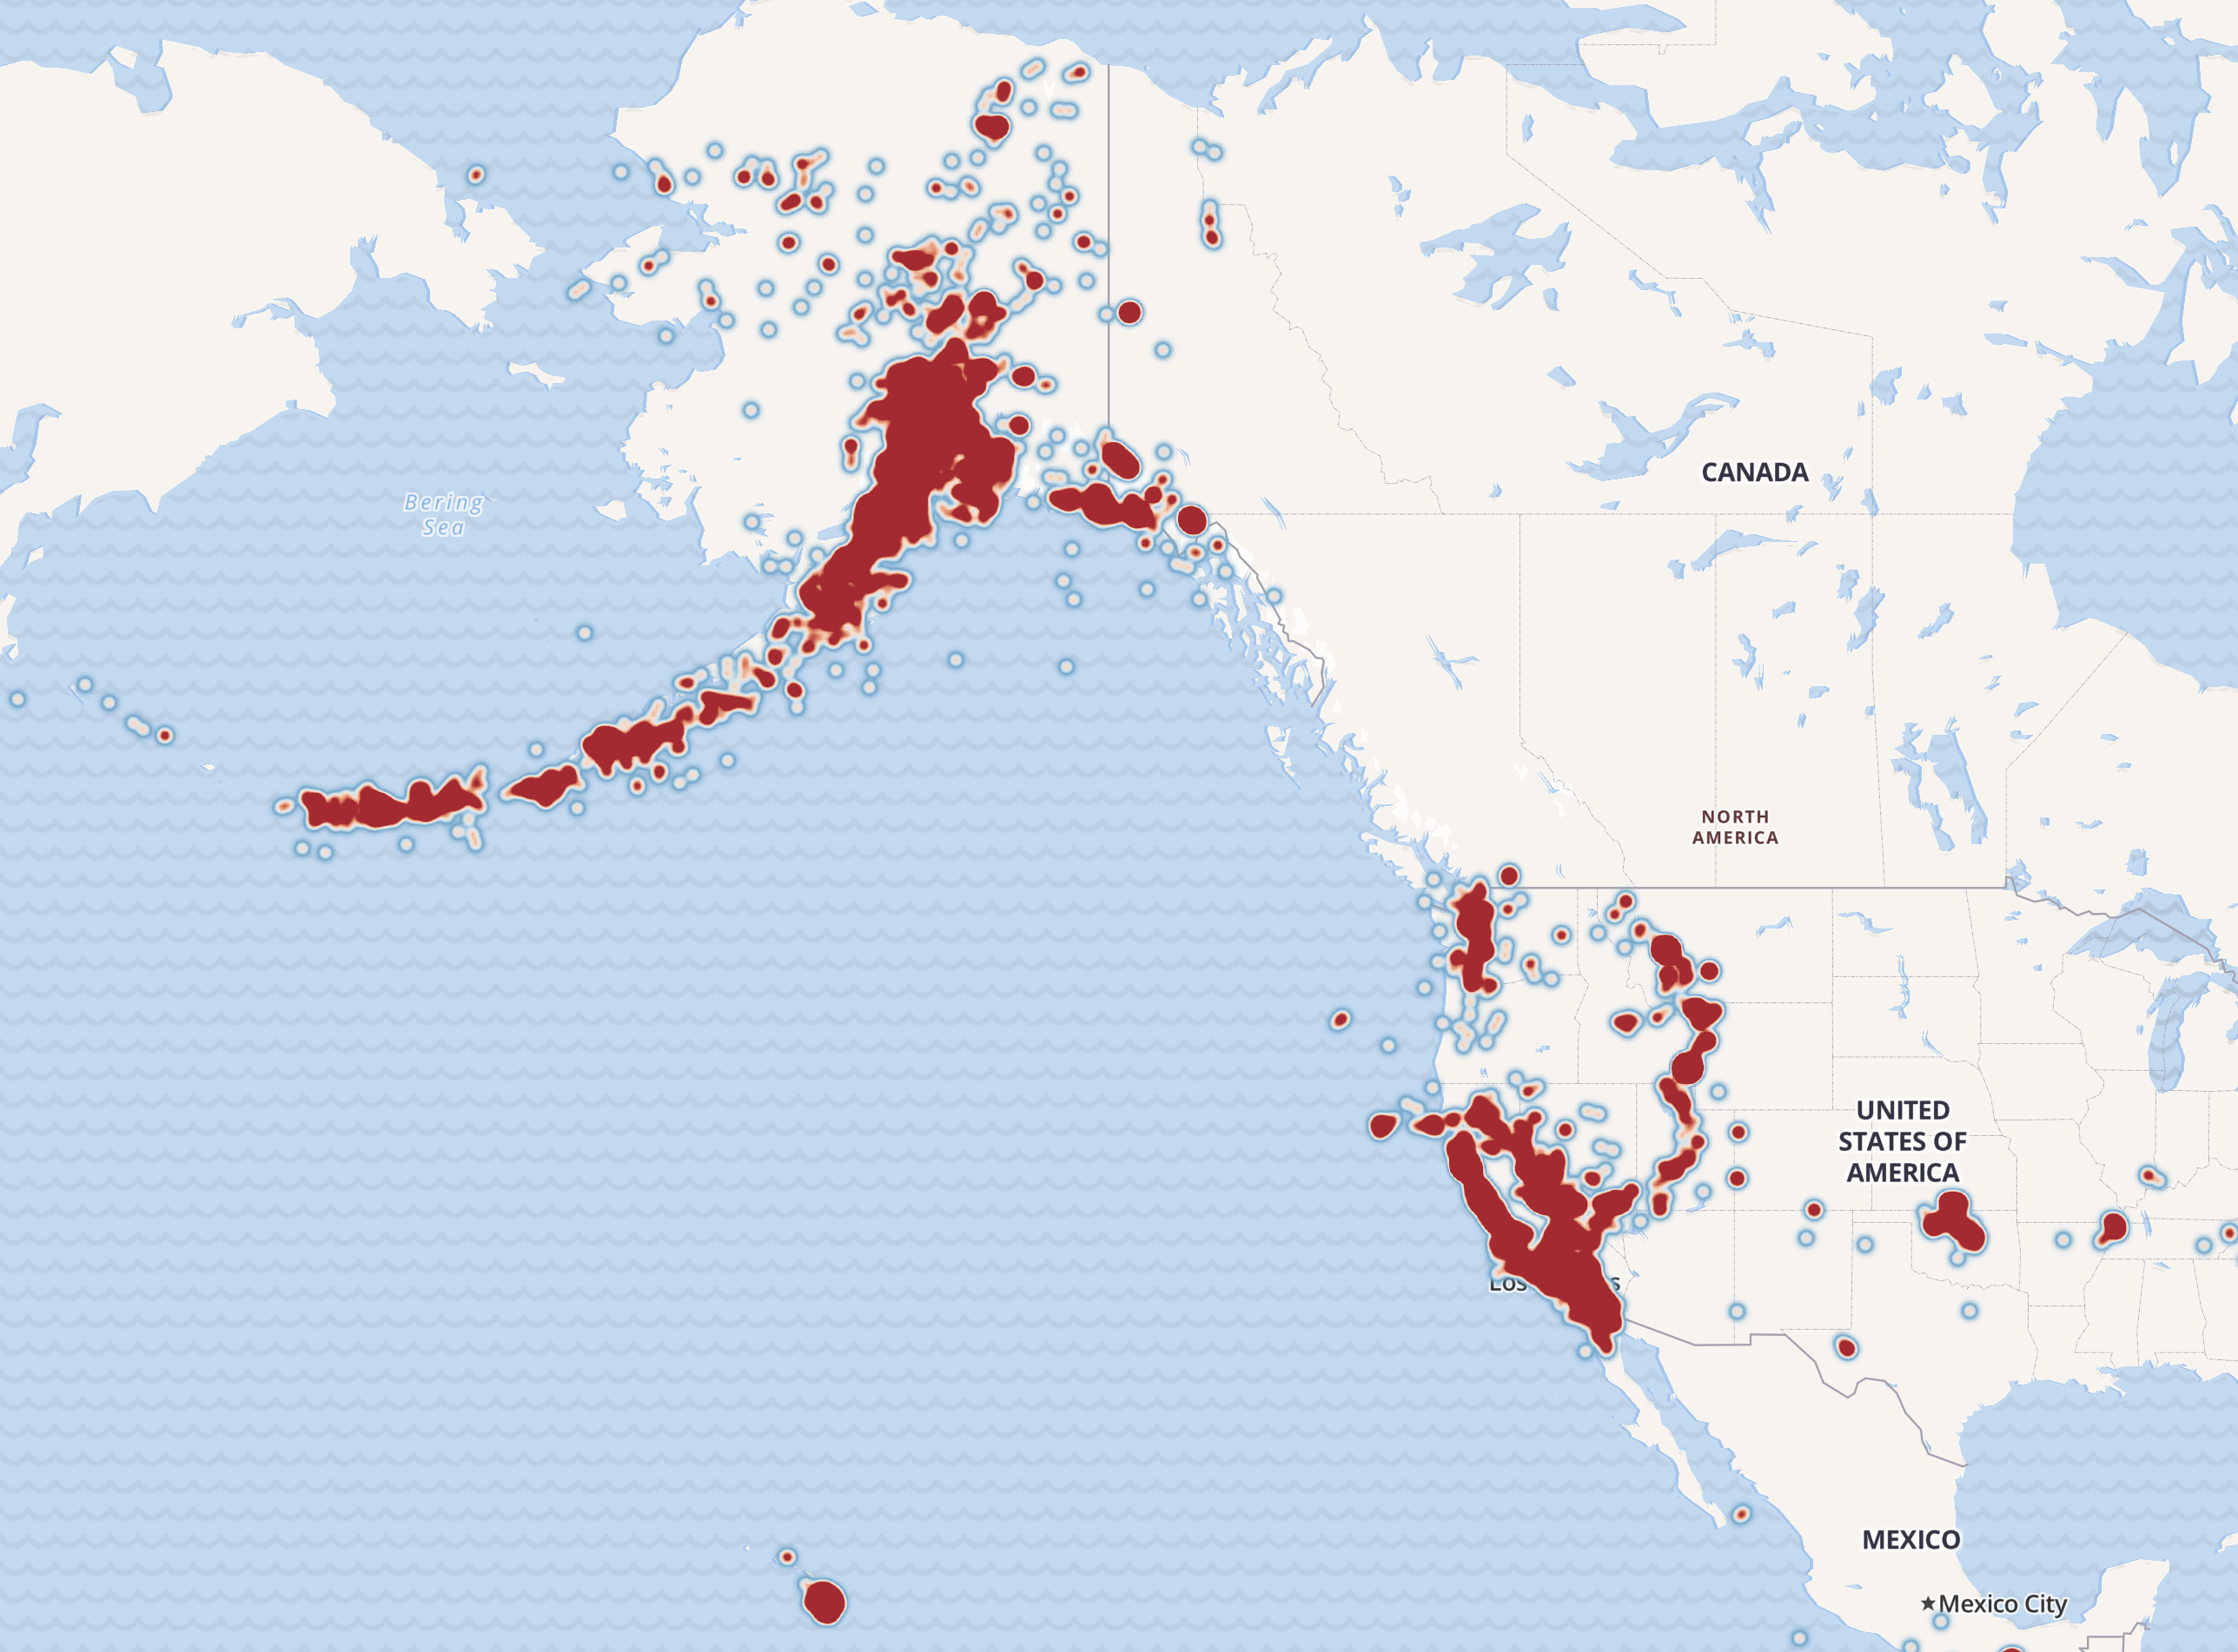
Heatmap will render a layer on the map's tile, showing data based on the count property of the geoJson file:
{
    type: 'Feature',
    properties: {
      id: 'companyId',
      Tooltip: <TooltipTest />,
      //will render a point with weight 1
      count: 1,
      icons: { people: true, like: false }
        },
        geometry: {
          type: 'Point',
          coordinates: {lat:-50.324462890625, lng:-10.024695711685304}
        }
},
{
    type: 'Feature',
    properties: {
      id: 'companyId',
      //will render a point with weight 50
      count: 50,
      icons: { people: true, like: false }
        },
        geometry: {
          type: 'Point',
          coordinates: {lat:-40.324462890625, lng:-9.024695711685304}
        }
},
Palettes
You can choose between different color palettes
- green
- blue
- red
- rainbow
import { MapRender } from "@matchplat/crono";

//one of "green" | "blue" | "red" | "raibow"
<MapRender heatmapPalette={"blue"} />;